P&L stands for Profit and loss statement, or PNL, is a report showing the profit and loss of a company over a certain period.
The principle of constructing the report is very simple: all income for the period is taken, expenses are subtracted from them. Based on the data obtained, you can understand whether the company worked at a loss or received income.
The P&L report acts as a link between the balance at the beginning of the period and at the end of the period, as it shows the dynamics of the change in the situation.
For example, the monthly revenue of a summer barbecue house amounted to $30,000, of which $23,000 came directly from the sale of barbecue, another $5,000 was received from the sale of drinks, and $2,000 was earned from the sale of semi-finished products. At the same time, expenses for the period amounted to $23,000, of which about $12,000 was spent on the purchase of meat, another $70,000 was spent on coal, $3,000 on the work of a cook and $1,000 on renting a point.
As we can see, our kebab house did not earn a net $7,000, although it seemed that it went into plus and brought a good profit. This is what P&L reports are for, to understand at what stage a serious loss of funds begins and how you can bring the company into plus.
The Profit and Loss Statement is one of the three main financial management analysis tools for any type of enterprise. It allows the investor, owner, shareholder to assess the marginality of the project at any time. And if the balance sheet is a “snapshot” of activity for a certain period (as of a specific date), then P&L reflects the financial result: the company made a profit or worked at a loss (by comparing income and expenses associated with obtaining this income).

The P&L report explains why (because of which incoming/outgoing transactions) the balance between the reporting dates has changed. In other words, an investor in the P&L report can see a picture of business performance: how much the company’s operating activities bring in, what part of the earned capital goes to cover current expenses, how the balance between income and expenditure is achieved, and, accordingly, what profit should be expected at the end of the reporting period. period (or how much of the profit will be received by equity participants, shareholders, investors, etc.).
P&L report is an integral part of management accounting, which allows you to make timely decisions aimed at business development. The frequency with which the profit and loss statement will be generated (monthly, quarterly or annually) depends on the accounting policy approved by the company.
As a rule, report generation does not require any special conditions or complex software. An ordinary accountant or economist may well be engaged in its preparation and maintenance. And the first thing he will have to face is a table in Excel, consisting of two main blocks “Income” and “Expenses”.
There is no clear definition of articles that must be reflected in one category or another. In many respects, this will depend on the specifics of the company's activities, the branching of the structure, the organization of the production process, the sales market, etc.
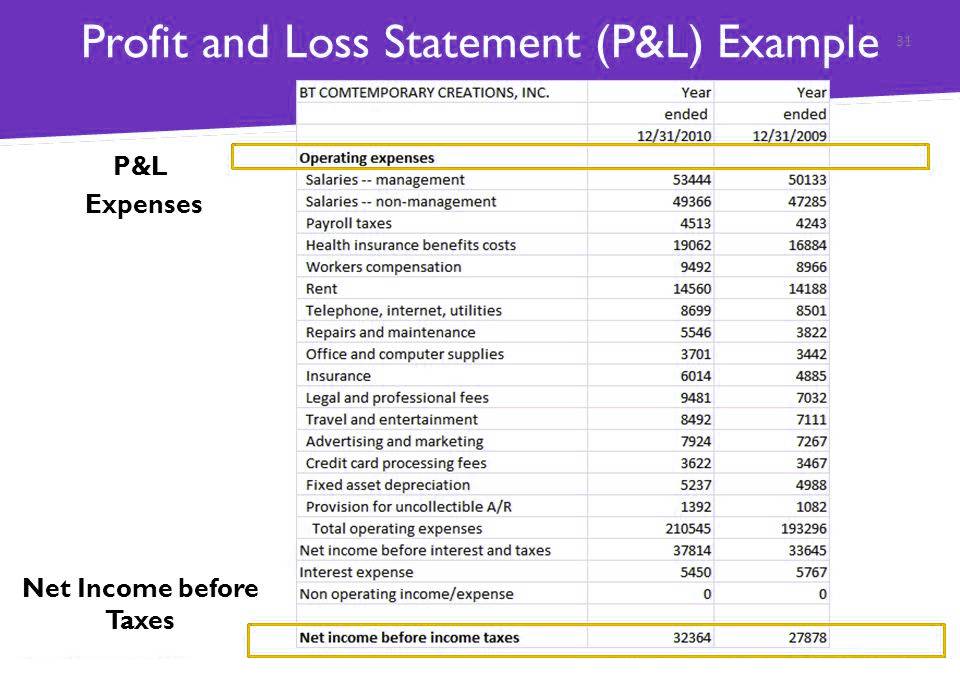
It is also worth considering an important nuance: according to IFRS (international standards), income and expenditure transactions must be entered in the summary table upon the fact of the transaction (i.e. when the goods are shipped, sold / purchased), and not by the date the funds are credited or spent. It is more convenient to reflect operations with monetary resources in a separate line in order to understand how much working capital the enterprise has at the reporting date (see the table from the example).
The report does not include indicators that cannot be reliably measured, but affect revenues (for example, customer loyalty or brand awareness).
Some figures may depend on the calculation methods used (for example, depreciation costs depend on the expected life of the equipment).

To make the right managerial decisions. This is your macro dashboard, based on which you can:
The PNL report is used by the economic department of the enterprise, it is required for the head of the company, founders, investors, and can be provided at the request of banks, counterparties.
In order to understand the real financial situation, in addition to PNL, other types of financial reports are needed:
The balance sheet, cash flow statement and PNL together give a complete picture of your company's financial health.
To read the report correctly, you need to understand the features and structure.
Peculiarities:
Net income isn't the only metric everyone looks at in the PNL report. There are others that are worth keeping an eye on.
Here they are:
Margin Profit - revenue minus variable costs. It helps to flexibly predict financial results depending on the number of goods/services sold.
Operating Profit - operating revenue minus operating expenses;
Net Sales - revenue minus discounts on goods / services, bonus loyalty programs and returns. It helps to have a more transparent view of sales and evaluate the contribution of the sales team.
EBITDA - earnings before interest, taxes and depreciation. Allows you to more soberly compare yourself with other companies, as it excludes taxes and debts.
Retained earnings - net income minus accrued and paid dividends.
Keep these metrics in mind to see the full context of the report.
The PNL report is a damn useful and vital piece that shows on a large scale how we have done relative to the past year. What steps do we need to take to grow next and what budget, given our spending, might be required to do so.
 What is P R bond?
27/11/2023
What is P R bond?
27/11/2023
 What is Compulsory Convertible Debentures?
27/11/2023
What is Compulsory Convertible Debentures?
27/11/2023
 Dynamics of Central Asian Economies
17/11/2023
Dynamics of Central Asian Economies
17/11/2023